Drinking Water Treatment
Access to safe, great-tasting drinking water underpins public health, industrial productivity, and social development. Yet raw waters—whether drawn from lakes, rivers, reservoirs, brackish aquifers, or seawater, typically contain suspended solids, microorganisms, organic pollutants, and dissolved ions at concentrations that exceed international potability limits. Drinking-water treatment therefore bridges the gap between natural supply and regulatory quality targets by combining physical, chemical, and biological processes in a carefully engineered sequence.
Over the last two decades the discipline has advanced from simple “sand-plus-chlorine” plants to sophisticated multi-barrier systems that can remove ultratrace contaminants while minimizing by-products, chemical use, and energy demand. Utility managers, EPC contractors, and facility owners today balance ever-tightening regulations (e.g., EU Drinking Water Directive 2024/2184, U.S. EPA’s PFAS limits) against the need for lifecycle cost control and sustainability metrics such as specific energy consumption (kWh m-³) and carbon intensity (kg CO₂ eq m-³).
This page offers a comprehensive, engineer-level overview of modern drinking-water purification. It begins with a concise catalogue of the main treatment technologies and their primary functions, then drills into design considerations, operational best practices, and emerging trends—equipping you with actionable knowledge to specify, operate, or optimize your next potable water project.
Related Products for Drinking Water Treatment
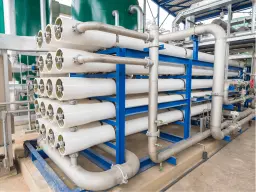
Reverse Osmosis
Uses semipermeable membranes to remove dissolved impurities, ensuring high-purity water for boiler feed.
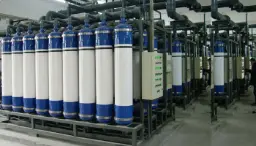
Ultrafiltration
Inside-out hollow fibers operate at 60–100 L m-² h-¹ using 1–2 bar transmembrane pressure (TMP); chemically enhanced backwash (CEB) with NaOCl prevents biofouling.
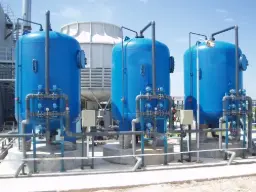
Media Filtration
Dual-media beds (0.45–0.55 mm silica + 1.0 mm anthracite) achieve filtration rates of 7–10 m h-¹, backwashed 1–2 day-¹; granular activated carbon (GAC) targets geosmin, MIB, and residual chlorine.
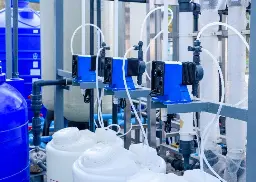
pH Adjustment & Corrosion Control
Lime or sodium carbonate raises Langelier Saturation Index (LSI) to −0.2 – +0.2; orthophosphate dosing forms protective film inside ductile-iron mains.
Snapshot of Core Treatment Processes
Treatment Step |
Typical Position in Train |
Primary Objective | Engineering Note |
|---|---|---|---|
| Coagulation–Flocculation | Very early | Destabilize colloids and form settleable flocs | Metal salts (alum, ferric chloride) or PAC rapidly neutralize surface charges; synthetic/biopolymer co-agulants then agglomerate particles into >100 µm flocs suitable for clarification. |
| Sedimentation / Lamella Clarification | After flocculation | Remove bulk suspended solids & some pathogens | Rectangular or inclined-plate clarifiers give hydraulic retention time (HRT) of 30–120 min; sludge collectors continuously scrape settled solids to hoppers for dewatering. |
| Media Filtration (Sand, Anthracite, GAC) | Mid-train or post-chemical | Polish turbidity to <0.1 NTU; adsorb taste & odor | Dual-media beds (0.45–0.55 mm silica + 1.0 mm anthracite) achieve filtration rates of 7–10 m h-¹, backwashed 1–2 day-¹; granular activated carbon (GAC) targets geosmin, MIB, and residual chlorine. |
| Ultrafiltration (UF) Membranes | Alternative to media filters | Provide absolute barrier (0.01 µm) to viruses & protozoa | Inside-out hollow fibers operate at 60–100 L m-² h-¹ using 1–2 bar transmembrane pressure (TMP); chemically enhanced backwash (CEB) with NaOCl prevents biofouling. |
| Nanofiltration (NF) / Reverse Osmosis (RO) | For high-salinity or micro-pollutant removal | Reject >90 % divalent ions, pesticides, PFAS | Energy-recovery devices and low-pressure, high-flux thin-film composite membranes have reduced specific energy to 0.8–1.2 kWh m-³ for brackish sources. |
| Ion Exchange (IX) | Targeted polishing | Eliminate hardness, nitrates, heavy metals | Strong-acid cation resin in sodium form lowers Ca²⁺/Mg²⁺ to <17 mg L-¹ as CaCO₃; WAC/weak-base pair systems can selectively remove boron. |
| Disinfection (Chlorine, ClO₂, Ozone, UV-C) | Final barrier (and residual) | Inactivate pathogenic bacteria & viruses | CT (concentration-time) calculations ensure 4-log Giardia & 5-log virus reduction; UV uses low-pressure amalgam lamps at 40 mJ cm-² dose for chemical-free primary kill. |
| Advanced Oxidation Processes (AOP) | Optional post-RO | Destroy trace organics & endocrine disruptors | Ozone+H₂O₂ or UV+H₂O₂ generates hydroxyl radicals (•OH, 2.8 V redox) that mineralize micro-pollutants to CO₂, H₂O and inorganic ions. |
| pH Adjustment & Corrosion Control | Endpoint conditioning | Stabilize finished water; protect distribution piping | Lime or sodium carbonate raises Langelier Saturation Index (LSI) to −0.2 – +0.2; orthophosphate dosing forms protective film inside ductile-iron mains. |
Why Robust Drinking-Water Treatment Matters
Public-Health Imperatives
Waterborne diseases kill an estimated 485 000 people annually, with pathogens such as Cryptosporidium parvum remaining infectious after conventional chlorination. High-quality treatment provides multi-barrier protection, ensuring turbidity <0.3 NTU 95 % of the time and zero detectable E. coli per 100 mL, as mandated by the WHO Guidelines for Drinking-water Quality (5th ed.).
Economic and Regulatory Drivers
Non-compliance fines, product recalls (for bottlers), and brand reputation damage far outweigh the incremental CAPEX of advanced treatment. Recent PFAS limits of 4 ng L-¹ in the U.S. have pushed utilities toward high-rejection NF and GAC end-polishers; similarly, the EU DWD 2024/2184 adds monitoring for endocrine-disrupting compounds, forcing upgrades in analytical labs and sensor integration.
Source Water Characterization & Pretreatment Strategy
Successful plant design starts with a thorough raw-water survey: seasonal turbidity, algae counts, NOM fractions (humic, fulvic), pathogen risk index, inorganics (Fe, Mn, As), and specific UV absorbance (SUVA) to predict disinfection-by-product (DBP) precursors. A hazard assessment matrix then maps each contaminant class to the most energy- and cost-efficient barrier, while pilot testing validates fouling indices (SDI, MFI-0.45) and coagulant demand.
| Parameter | Typical Range (Surface Water) | Design Trigger |
|---|---|---|
| Turbidity | 1–50 NTU | >10 NTU ⇒ dual-stage clarification + UF |
| True Color | 5–50 Pt-Co | >15 Pt-Co ⇒ GAC or enhanced coagulation |
| TDS | 50–1500 mg L-¹ | >500 mg L-¹ ⇒ NF/RO or IX desalination |
| pH | 6.5–8.5 | <7 ⇒ lime dosing to optimize coagulation |
Multi-Barrier Treatment Train Design
Conventional Treatment Path
Most municipal plants still follow the classic coagulation–flocculation-sedimentation–filtration chain. Optimal alum dosage of 40–60 mg L-¹ at pH 6.3–6.8 destabilizes colloids; paddle mixers (G = 900 s-¹) promote rapid dispersion, followed by slow mixing (G = 30–50 s-¹) for floc growth. Clarifiers with 90 m h-¹ surface overflow rate achieve 95 % solids removal, enabling dual-media filters to consistently meet <0.1 NTU effluent turbidity.
Membrane-Based Alternatives
Ultrafiltration replaces granular filters when pathogens pose a high risk or a small footprint is essential. Skid-mounted, dead-end UF modules deliver water at SDI < 3, making them ideal RO pretreatment in desalination plants. For coastal or high-TDS sources, a two-pass RO (with inter-stage pH adjustment) produces <10 mg L-¹ TDS product, while energy-recovery turbines cut SEC by up to 50 %.
Hybrid & Advanced Processes
- Ozone-Biological Activated Carbon (O₃-BAC): Ozone oxidizes organics to biodegradable fragments, which BAC then removes; synergistically lowers TOC and control taste/odor.
- Ceramic Membrane + PAC Slurry: The ceramic barrier resists abrasive wear, allowing PAC dosing for micro-pollutant adsorption without risking fiber breakage.
- UV-LED Disinfection: Emerging 265 nm LEDs promise chemical-free residual-free disinfection in small community systems; current challenges include lamp-life and electrical efficiency.
Disinfection and Residual Management
Maintaining a residual disinfectant throughout distribution is vital. Chloramines, produced by combining chlorine and ammonia at Cl:N ≈ 4.5:1, provide a more stable yet weaker residual than free chlorine. Utilities must balance biofilm suppression with nitrosamine formation risk. Peracetic acid (PAA) is gaining popularity for its broad-spectrum efficacy and benign by-products (acetic acid, oxygen).
Operational Best Practices
- Real-Time Turbidity Profiling: Install multiple low-range (0–1 NTU) nephelometers across each filter to detect breakthrough early and trigger backwash.
- Membrane Integrity Testing (MIT): Daily pressure-hold or diffusive air flow tests ensure log-removal credit compliance, essential under USEPA LT2ESWTR.
- SCADA-Based Coagulant Control: PID algorithms use streaming UV254 and zeta potential data to dose coagulant within ±5 % of optimum, reducing sludge by 15 – 20 %.
- Asset Management: Vibration sensors on high-lift pumps combined with AI-driven predictive maintenance can cut unplanned downtime by 30 %.
Sustainability & Cost Considerations
Energy accounts for 30 – 60 % of OPEX in membrane-centric plants. Deploying variable-frequency drives (VFDs), optimizing RO recovery (up to 85 % for brackish feed with antiscalant), and harvesting waste heat for chlorine generation all slash footprint and emissions. Life cycle analysis (LCA) highlights that GAC regeneration and alum sludge disposal dominate global warming potential (GWP) for conventional schemes, steering planners toward coagulant recovery and electrochemical sludge dewatering.
Regulatory Landscape
Region | Primary Regulation | Compliance Metric |
|---|---|---|
| USA | Safe Drinking Water Act, Stage 2 DBPR | TTHMs <80 µg L-¹; HAA5 <60 µg L-¹ |
| EU | Directive (EU) 2024/2184 | PFAS-Sum <0.5 µg L-¹; Bisphenol A <2.5 µg L-¹ |
| WHO | GDWQ 5th Edition | Guideline values (GV) for 195 parameters |
| Türkiye | 2023 İçme ve Kullanma Suyu Reg. | Turbidity <1 NTU; Al <200 µg L-¹ |
Staying abreast of these limits informs selecting technology and monitoring frequency. Automated lab-on-chip analyzers now track bromate, nitrite, and microcystins in near-real time, enabling dynamic operation within regulatory margins.
Future Trends
- AI-Enabled Digital Twins: Virtual replicas of treatment plants optimize chemical consumption and predict membrane fouling days in advance, saving up to 12 % OPEX.
- Low-Pressure RO (LPRO) Membranes: Novel 0.8 mil active layers cut operating pressure by 20 %, making RO attractive even for moderate-salinity rivers.
- Electrochemical Ceramic Filtration (ECF): Combines electrocoagulation with tubular ceramic filters in a single unit, eliminating external chemicals.
- Photocatalytic Graphene Composites: When integrated into UV reactors, these achieve simultaneous disinfection and PPCP degradation.
Conclusion
Designing a resilient, regulation-compliant drinking-water treatment plant is a multi-disciplinary challenge that demands not only mastery of individual process fundamentals but also a holistic understanding of source water variability, residual management, sustainability, and cost control. From conventional coagulation trains to cutting-edge RO + AOP hybrids, every technology has a defined operating window and integration strategy. By applying sound engineering principles—pilot testing, real-time monitoring, and predictive analytics, utilities and industrial operators can secure reliable, affordable potable water while meeting the escalating expectations of regulators and consumers alike.